
The purpose of the below piece is to demonstrate how Lorntine Capital uses ORATS (Options Research and Technology Services) in our own backtesting. Note: ORATS does not
I love the software, and it has saved me literally months of keying in data, so I have no issue telling others about it. Hopefully, this will also provide some more insight into the Anchor Strategy and how it was developed.
In 2011 when Anchor was first being developed, testing the strategy was a Herculean task. I did not have access to any files of old option data, backtesting software or any of the programs that are available today to assist in the process of backtesting. When we had a proposed strategy, we had to painstakingly go through ThinkOrSwim’s “ThinkBack” feature that has day end option pricing. An excel spreadsheet would be created, several years of data would be typed in by hand, and then the data would be tested. If a result was not what we wanted, and, for example, we wanted to move the subject option from a 50 delta position to a 33 delta position, then it would take two more days of work just to key in the new option prices. Every minor change to the test was an effort of days.
Then we were introduced to ORATS , which has made testing simpler, and helped create the current version of Leveraged Anchor that we are currently trading. It also makes answering member questions about the adaptability of the Anchor strategy much simpler.
For instance, in the past few months, three different readers have asked “Can I use the Anchor Strategy or the Leveraged Anchor Strategy to trade gold through the GLD ETF?” My initial thought was “Well, it should be possible,” but thoughts and feelings aren’t exactly evidence. So, I dove into ORATS to actually test the theory.
The first thing to do is to determine the cost of the long hedge, which can be done without ORATS by simply pulling up today’s options prices and looking – if the cost of the hedge is more than the average yearly gain in GLD, then there is no chance Anchor will work. For example, if GLD’s average gain over the last two years was 5% per year, but the average cost of an annual hedge was 8%, then there would be no point in checking further as hedging would be cost prohibitive.
On the day of writing this article, the GLD option we would use to hedge would be the September 30, 2020 option. With GLD currently trading at 138.72, the five percent out of the money put is the 132 put, which is trading for $2.24, or less than two percent of the price of the underlying. This makes it “seem” like GLD might be a good candidate for Anchor or Leveraged Anchor because it appears to have a cheap long-term hedge compared to the performance of GLD over the past two or three years.Passing the first quick test, we need to build out a model and see if the strategy works over a longer time frame.
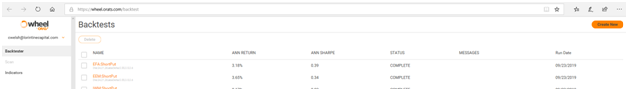
The next thing to determine is if it is possible to pay for that hedge in a given year by selling short puts against the cost of the long hedge. If selling short puts does not have a positive annual return on average, the strategy will not work. This is where ORATS comes in handy. We start with the software by going into “Wheel” and clicking on the orange button in the top right corner that says “Create New.”
This takes us to the following screen:
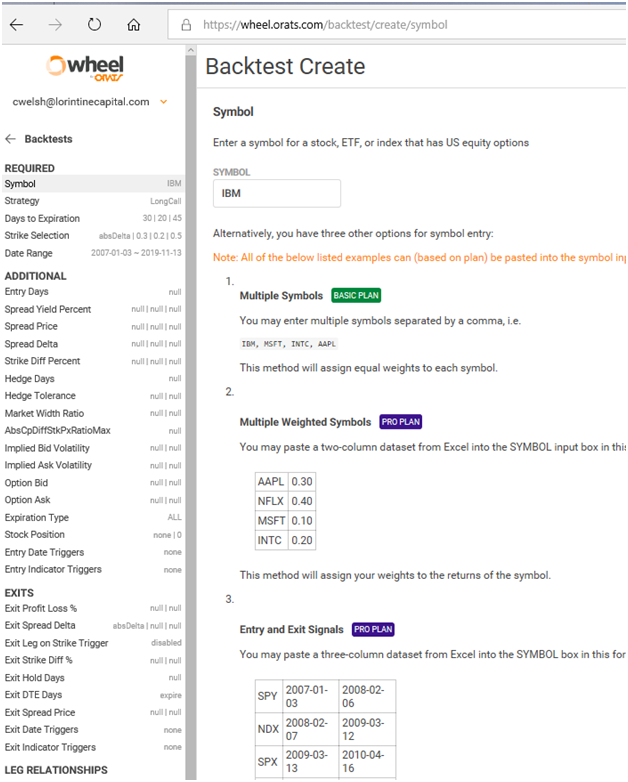
We enter the test parameters on this page. For the initial test, we used the same parameters as for the Leveraged Anchor Strategy short puts:
- Symbol: GLD
- Strategy: Short Put
- Days to Expiration: Target: 24 Min: 21 Max: 30
- Strike Selection: Target .55 Min .49 Max .59
- Exit Profit Loss %: Min: blank Max 1.66
- Exit DTE 1
Then click “submit.” Processing can take several minutes, so be patient with the system. When done, it spits out the results:
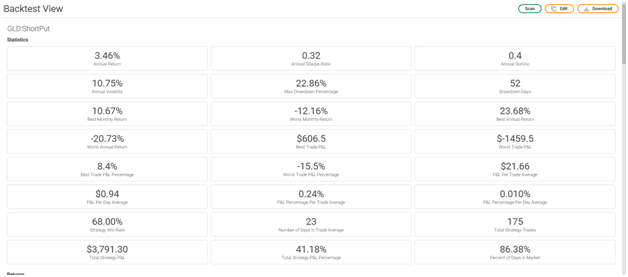
The good news is that there is a positive annual average return. It’s even better that the positive return is in excess
However, for our testing purposes, the real value comes in the monthly returns the software provides:
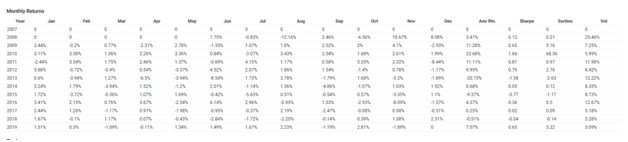
We can now use those monthly returns to start modeling a Leveraged Anchor Strategy in excel. I simply cut and paste the data into my spreadsheet, where I can then manipulate it.
Our next step is to find out the returns of the deep in the money long calls (the leveraged portion of Levered Anchor). Here, we simply go back to “Create New” in Orats and change our strategy inputs to:
- Symbol: GLD
- Strategy: LongCall
- Days to Expiration: Target 366 Min 365 Max 430
- Strike Selection Target .95 Min 0.94 Max 1
Remember, we use a minimum of 365 to ensure long term capital gains treatment on the long holdings. Since we’ll always be holding this to expiration, the rest of the fields are left blank
And we get the following results:
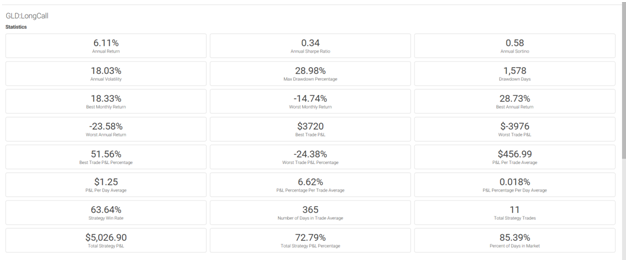
However, this doesn’t look right. It says we’re only in the market 85.39% of the days, and we should be in the market close to 100% of the time. This most likely means our “days to expiration” field wasn’t big enough and there might not have been an option available. So we re-run the test, changing the max days from 430 to 460. After doing this, similar results come out and we still are not in the market enough. At this point, I go to the individual month returns to determine what is wrong. After digging into the data that was returned, we realize that the software doesn’t support GLD options prior to October 2009, so we had a long period of just being in “cash.”
This issue can be fixed by editing our test in the “Date Range” category and changing the start date to 2009-10-01, which gives us:
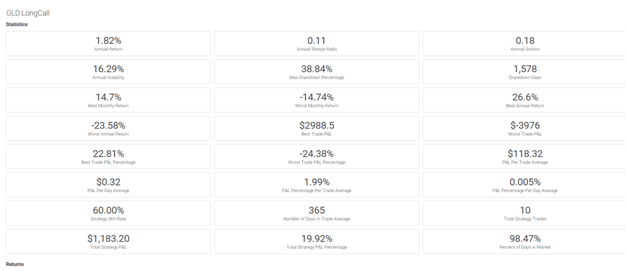
These results are not near as good, showing an annual return of just under two percent.
In fact, this seems quite low, so we need to do a data check. Since this is a deep in the money call position, returns should be near what stock performance has been over the same period. GLD’s performance is easily found on yahoo finance or any other stock data site. Since November 2009, the current prices of GLD has increased from 115 to 138 or 20% (2% per year). We’re trading a 95 delta position, so we would expect our returns to be 1.9% per year and got 1.82%. In other words, these returns are likely correct (and I note that gold has not performed well over the last decade, at all).
We then copy the same monthly data into our excel spreadsheet.
For our last piece, we need to run the returns for the long puts (the hedge):
- Symbol: GLD
- Strategy: Long Put
- Days to Expiration: Target 365 Min 320 Max 430
- Strike Selection (stockOTMPercentage) Target .95 Min: .93 Max .98
- Date Range: 2009-10-01 to Current
- Exit DTE 21
- Exit Profit Loss % Min .33
The last category (Exit Profit Loss %) is the only one I don’t like. Since we roll the long hedge when the underlyingreally difficult to determine what the loss on the long put would be at that point, as its variable depending on how many days are left in the long hedge, current market volatility, and other factors. For instance, if the market in GLD moves up 8% in the first week after opening the position, the long put may only lose 50% of its value. We would typically roll the position then, but the software would not. Whereas if the market goes up 10% in a week with a month to expiration, it may lose 90% of its value, but the hedge would have rolled a bit too early in the software. However, we are not using the software to do a to the penny backtest at this point, rather testing the theory.
So the 33% is really more a “guess” for purposes of this initial test. If it passes, when conducting a “full” Anchor Test, I leave the Exit Profit Loss category blank, go back through manually from the long call data and flag exactly when the rolls will occur. This is a slight increase in labor but not much. (Though if ORATS were to build in a feature that had entries/exits based on moves of the underlying, that would be a great feature addon).
And with all of the above information, we now have the return information for the short puts, the long calls, and the long puts, and can manipulate it as necessary to determine an “optimum” level of leveraged, hedging, and whatever else would like to include in implementing Anchor on GLD.
Once that process is done, you can see how the strategy performs, which unfortunately, is “not that well.” Changing leveraged ratios around really doesn’t help much. Digging into the data demonstrates why – when there’s a big downturn in the price of GLD, the hedge does not
Anchor always performs the worst on instruments that remain “mostly flat.” Over the last decade, GLD has moved less than two percent per year on average. There are periods where Anchor would have worked quite well on GLD, for instance 2009-2012 and even into 2013. However, since mid-2013, the price of GLD has remained in a tight range, which isn’t good for Anchor. As this is not a historically unusual trading patter for GLD, it basically rules out using the Anchor strategy on it.
Logically this makes sense, as historically gold has been a good inflation hedge. With annual inflation over the last 5 years or so being under control, one would not expect the price of GLD to move much – and it hasn’t. ORATS simply helped verify these conclusions.
Christopher Welsh is a licensed investment advisor and president of LorintineCapital, LPCERTIFIED FINANCIAL PLANNER™
What Is SteadyOptions?
Full Trading Plan
Complete Portfolio Approach
Diversified Options Strategies
Exclusive Community Forum
Steady And Consistent Gains
High Quality Education
Risk Management, Portfolio Size
Performance based on real fills
Non-directional Options Strategies
10-15 trade Ideas Per Month
Targets 5-7% Monthly Net Return
Recent Articles
Articles
Pricing Models and Volatility Problems
Most traders are aware of the volatility-related problem with the best-known option pricing model, Black-Scholes. The assumption under this model is that volatility remains constant over the entire remaining life of the option.
By Michael C. Thomsett, August 16

- Added byMichael C. Thomsett
- August 16
Option Arbitrage Risks
Options traders dealing in arbitrage might not appreciate the forms of risk they face. The typical arbitrage position is found in synthetic long or short stock. In these positions, the combined options act exactly like the underlying. This creates the arbitrage.
By Michael C. Thomsett, August 7
- Added byMichael C. Thomsett
- August 7
Why Haven't You Started Investing Yet?
You are probably aware that investment opportunities are great for building wealth. Whether you opt for stocks and shares, precious metals, forex trading, or something else besides, you could afford yourself financial freedom. But if you haven't dipped your toes into the world of investing yet, we have to ask ourselves why.
By Kim, August 7

- Added byKim
- August 7
Historical Drawdowns for Global Equity Portfolios
Globally diversified equity portfolios typically hold thousands of stocks across dozens of countries. This degree of diversification minimizes the risk of a single company, country, or sector. Because of this diversification, investors should be cautious about confusing temporary declines with permanent loss of capital like with single stocks.
By Jesse, August 6

- Added byJesse
- August 6
Types of Volatility
Are most options traders aware of five different types of volatility? Probably not. Most only deal with two types, historical and implied. All five types (historical, implied, future, forecast and seasonal), deserve some explanation and study.
By Michael C. Thomsett, August 1
- Added byMichael C. Thomsett
- August 1
The Performance Gap Between Large Growth and Small Value Stocks
Academic research suggests there are differences in expected returns among stocks over the long-term. Small companies with low fundamental valuations (Small Cap Value) have higher expected returns than big companies with high valuations (Large Cap Growth).
By Jesse, July 21
- Added byJesse
- July 21
How New Traders Can Use Trade Psychology To Succeed
People have been trying to figure out just what makes humans tick for hundreds of years. In some respects, we’ve come a long way, in others, we’ve barely scratched the surface. Like it or not, many industries take advantage of this knowledge to influence our behaviour and buying patterns.
- Added byKim
- July 21
A Reliable Reversal Signal
Options traders struggle constantly with the quest for reliable
By Michael C. Thomsett, July 20
- Added byMichael C. Thomsett
- July 20
Premium at Risk
Should options traders consider “premium at risk” when entering strategies? Most traders focus on calculated maximum profit or loss and breakeven price levels. But inefficiencies in option behavior, especially when close to expiration, make these basic calculations limited in value, and at times misleading.
By Michael C. Thomsett, July 13
- Added byMichael C. Thomsett
- July 13
Diversified Leveraged Anchor Performance
In our continued efforts to improve the Anchor strategy, in April of this year we began tracking a Diversified Leveraged Anchor strategy, under the theory that, over time, a diversified portfolio performs better than an undiversified portfolio in numerous metrics. Not only does overall performance tend to increase, but volatility and drawdowns tend to decrease:
Tuesday, February 20, 2018