
When a daily session moves in the direction opposite the prevailing trend, it is called a “divergent bar.” As a reversal day, it signals a likely change from bullish to bearish, or from bearish to bullish.
A characteristic of the true divergent bar reversal is that the day’s session open at a gap from the previous day, and then closes within the range of the previous real body (in the upper half for a bullish move, or in the lower half in a bullish divergence).
The divergent bar signal is exceptionally strong as a reversal, assuming it is also confirmed by other signals. For example, on the chart of Tesla (TSLA), two examples of divergent bars meet these three criteria: sessions move opposite the prevailing trend, they appear with gaps, and they are strongly confirmed. Perhaps most important, they lead to reversal as predicted.
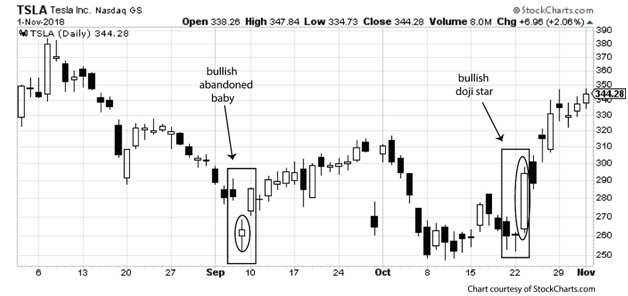
In the first example, a downtrend was underway until early September and represented a 100-point decline from the high of $380 to $280 per share. The downward gap leading to the divergent bar was exceptionally large, especially compared to the typical price pattern preceding this action. The single-day islands was divergent and was the middle session of the bullish abandoned baby, confirming the divergence as a bullish reversal.
In the second example, a downtrend had been set from early October and a 70-point move by the third week of October was significant. After a brief retracement, price appeared to resume the downtrend until the long white candlestick reversed the trend. It also served as the third session in the bullish reversal, a bullish doji star. This was the beginning of an 80-point rally to the end of the chart.
The divergent bar has exceptional predictive strength, assuming independent confirmation is also present. It tends to create an immediate reversal rather than a deferred or delayed one. Some other signals, with less specific strength or proximity to resistance or support, may experience a delayed reaction or even turn out to be false signals. The divergent bar is worth searching for, given its stronger than average signaling strength.
Look for strong confirmation in the form of candlesticks. The examples in the above chart had two exceptional three-session reversals. There are many more than could appear. The key is to find reversal signals that contain gaps. This conforms well to the requirement for divergent bars; however, signals with gaps also tend to be stronger than average.
Other forms of reversal may include a volume spike; but the definition of a true spike should be kept in mind as well. A spike is a one- or two-day period with unusually high volume, and an immediate return to the more typical volume experienced previously.
Momentum provides another worthwhile form of confirmation, especially Relative Strength Index (RSI) that has moved below index 20 (bullish oversold) or above index 80 (bearish overbought). Moving averages also are worth tracking, especially using a 50-day and 200-day together. The reversal is based on crossover; however, moving averages are lagging signals, so use them with caution.
An exception to this is Bollinger Bands. Even though its moving average-based middle band is also lagging, the standard deviation of upper and lower bands can provide useful signals of coming retracement or reversal. When Bollinger Bands is combined with the t-line (8-day exponential moving average), the resulting channel is a powerful trend tracking signal.
Michael C. Thomsett is a widely published author with over 80 business and investing books, including the best-selling Getting Started in Options , coming out in its 10th edition later this year. He also wrote the recently released The Mathematics of Options . Thomsett is a frequent speaker at trade shows and blogs on his website at Thomsett Guide as well as on Seeking Alpha, LinkedIn, Twitter and Facebook.
What Is SteadyOptions?
Full Trading Plan
Complete Portfolio Approach
Diversified Options Strategies
Exclusive Community Forum
Steady And Consistent Gains
High Quality Education
Risk Management, Portfolio Size
Performance based on real fills
Non-directional Options Strategies
10-15 trade Ideas Per Month
Targets 5-7% Monthly Net Return
Recent Articles
Articles
Pricing Models and Volatility Problems
Most traders are aware of the volatility-related problem with the best-known option pricing model, Black-Scholes. The assumption under this model is that volatility remains constant over the entire remaining life of the option.
By Michael C. Thomsett, August 16

- Added byMichael C. Thomsett
- August 16
Option Arbitrage Risks
Options traders dealing in arbitrage might not appreciate the forms of risk they face. The typical arbitrage position is found in synthetic long or short stock. In these positions, the combined options act exactly like the underlying. This creates the arbitrage.
By Michael C. Thomsett, August 7
- Added byMichael C. Thomsett
- August 7
Why Haven't You Started Investing Yet?
You are probably aware that investment opportunities are great for building wealth. Whether you opt for stocks and shares, precious metals, forex trading, or something else besides, you could afford yourself financial freedom. But if you haven't dipped your toes into the world of investing yet, we have to ask ourselves why.
By Kim, August 7

- Added byKim
- August 7
Historical Drawdowns for Global Equity Portfolios
Globally diversified equity portfolios typically hold thousands of stocks across dozens of countries. This degree of diversification minimizes the risk of a single company, country, or sector. Because of this diversification, investors should be cautious about confusing temporary declines with permanent loss of capital like with single stocks.
By Jesse, August 6

- Added byJesse
- August 6
Types of Volatility
Are most options traders aware of five different types of volatility? Probably not. Most only deal with two types, historical and implied. All five types (historical, implied, future, forecast and seasonal), deserve some explanation and study.
By Michael C. Thomsett, August 1
- Added byMichael C. Thomsett
- August 1
The Performance Gap Between Large Growth and Small Value Stocks
Academic research suggests there are differences in expected returns among stocks over the long-term. Small companies with low fundamental valuations (Small Cap Value) have higher expected returns than big companies with high valuations (Large Cap Growth).
By Jesse, July 21
- Added byJesse
- July 21
How New Traders Can Use Trade Psychology To Succeed
People have been trying to figure out just what makes humans tick for hundreds of years. In some respects, we’ve come a long way, in others, we’ve barely scratched the surface. Like it or not, many industries take advantage of this knowledge to influence our behaviour and buying patterns.
- Added byKim
- July 21
A Reliable Reversal Signal
Options traders struggle constantly with the quest for reliable
By Michael C. Thomsett, July 20
- Added byMichael C. Thomsett
- July 20
Premium at Risk
Should options traders consider “premium at risk” when entering strategies? Most traders focus on calculated maximum profit or loss and breakeven price levels. But inefficiencies in option behavior, especially when close to expiration, make these basic calculations limited in value, and at times misleading.
By Michael C. Thomsett, July 13
- Added byMichael C. Thomsett
- July 13
Diversified Leveraged Anchor Performance
In our continued efforts to improve the Anchor strategy, in April of this year we began tracking a Diversified Leveraged Anchor strategy, under the theory that, over time, a diversified portfolio performs better than an undiversified portfolio in numerous metrics. Not only does overall performance tend to increase, but volatility and drawdowns tend to decrease:
Thursday, September 27, 2018