
The first condition to declare the market is in bullish mode has been fulfilled. Now it is Ethereum's turn to assume its part of the game. XRP/USD keeps a low profile, waiting for its chance. We begin the week of analysis celebrating the bullish behavior of Bitcoin late on Sunday.
BTC/USD has broken above the $8,250 level escaping the long-term bearish channel that had governed its movements since early 2018.
Its teammates on the crypto podium have followed King Bitcoin up, but with worse performances. This characteristic of the rise means that the second condition that I pointed out in a previous article is not fulfilled.
Let us review the requirements. The first was that BTC/USD exceeds $8,250. The second condition is that the ETH/BTC crypto cross goes into bullish mode, and that has not been accomplished yet. However, it may change in the next few days.
ETH/BTC 4 Hours Chart
The ETH/BTC is trading at the 0.03067 level, moving between the EMA50 and the SMA100. Trading between mobile lines generates sudden short travel movements.
Above the current price, the first resistance level is at 0.0312 (upper parallel bullish trend line and EMA50), then the second resistance level awaits at 0.03161 (price congestion resistance). The third resistance level for ETH/BTC is at 0.0332 (upper parallel bullish trend line and price congestion resistance).
Below the current price, the first support level is at 0.0301 (SMA100, price congestion support, and SMA200), then the second support level is 0.0298 (price congestion support). The third support level for ETH/BTC awaits at 0.0275 (price congestion support).
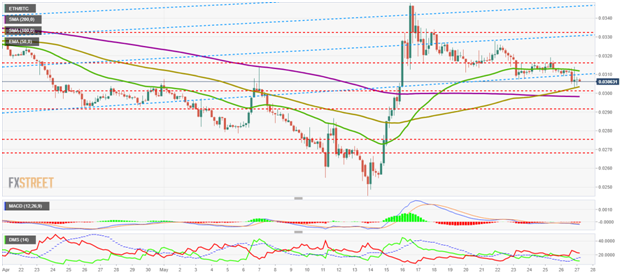
The MACD on the four-hour chart shows a slightly bearish profile, although it can easily turn up and quickly enter the positive zone of the indicator. This is a misleading profile at the time of analysis.
The DMI on the four-hour chart shows bears controlling the asset but with a downward profile. Bulls lose the ADX support, potentially complicating bullish development.
BTC/USD Daily Chart
BTC/USD is currently trading at $8,777 after hitting a relative high of $8.944. The Japanese daily candlestick chart is currently drawing a doji that jeopardizes the technical conquest if it ends the session with this figure.
Above the current price, the first resistance level is at $8,780 (price congestion resistance), then the second resistance level is at $9,160(price congestion resistance). The third resistance level for the BTC/USD pair is at $9,700 (price congestion resistance).
Below the current price, the first support level is at $8,400 (price congestion support), then the second support level is at $8,250 (price congestion support and upper trend line of the long term down channel). The third level of support is back into the bear channel at $8,000 (price congestion support).
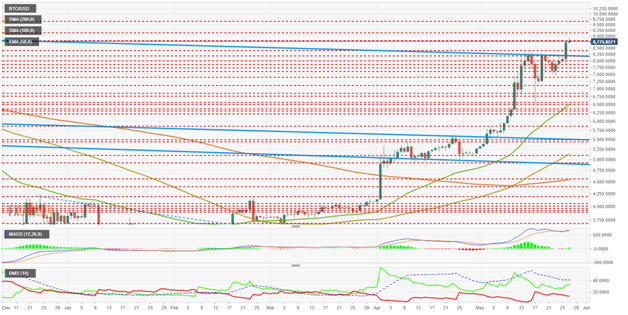
The MACD on the daily chart shows how after a bearish cross attempt, it bounced back and now takes advantage of the momentum to break out of the past bearish scenario. The next two days will mark the medium-term scenario.
The DMI in the daily chart shows the bulls increasing the advantage against the bears but still far from surpassing the ADX line that would start a new bullish pattern.
ETH/USD Daily Chart
The ETH/USD is currently trading at $268.16 after yesterday's new high relative to the close. The next resistance level is further away at $290, and reaching it requires accumulating bullish strength.
Above the current price, the first resistance level is at $290 (price congestion resistance), then the second resistance level is at $305(price congestion resistance). The third resistance level for ETH/USD is $318 (price congestion resistance).
Below the current price, the first support level is $260 (price congestion support), then the second support level is $250 (price congestion support). The third level of support for ETH/USD is at $234(price congestion support).
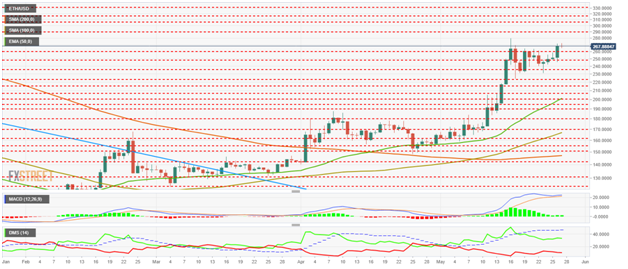
The MACD on the daily chart shows a bullish rebound after the first bearish cross attempt. It is not a very solid structure, so if it continues to rise, it will be in an overbought scenario.
The DMI on the daily chart shows how bulls keep control of the situation and barely celebrate the new relative high. The bears, on the other hand, weaken and remain at the lows.
XRP/USD Daily Chart
XRP/USD is currently trading at the $0.41 price level after sitting a daily high at $0.42. At this hour it loses support for price congestion at$0.412 and hints at a possible downward turning Japanese candle figure.
Above the current price, the first resistance level is $0.412 (price congestion resistance), then the second resistance level is $0.43(price congestion resistance). The third resistance level for the XRP/USD pair is $0.438 (price congestion resistance).
Below the current price, the first support level is $0.39 (price congestion support), then the second support level is $0.37 (price congestion support). The third support level for the XRP/USD pair is $0.35 (EMA50).
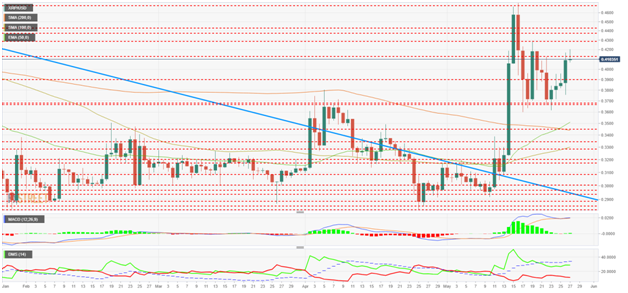
The MACD on the daily chart shows a small upward bounce after the first bearish cross attempt. As in the other cases, it may continue to rise, but in an overbought environment.
The DMI on the daily chart shows the bulls reacting up and moving very close to the ADX line. If the D+ were above the ADX, we could easily see a bullish explosion. The bears continue to show weakness.
This is a guest post from FXStreet, a leading provider of data, real time analysis and actionable tools for Forex traders.
What Is SteadyOptions?
Full Trading Plan
Complete Portfolio Approach
Diversified Options Strategies
Exclusive Community Forum
Steady And Consistent Gains
High Quality Education
Risk Management, Portfolio Size
Performance based on real fills
Non-directional Options Strategies
10-15 trade Ideas Per Month
Targets 5-7% Monthly Net Return
Recent Articles
Articles
Pricing Models and Volatility Problems
Most traders are aware of the volatility-related problem with the best-known option pricing model, Black-Scholes. The assumption under this model is that volatility remains constant over the entire remaining life of the option.
By Michael C. Thomsett, August 16

- Added byMichael C. Thomsett
- August 16
Option Arbitrage Risks
Options traders dealing in arbitrage might not appreciate the forms of risk they face. The typical arbitrage position is found in synthetic long or short stock. In these positions, the combined options act exactly like the underlying. This creates the arbitrage.
By Michael C. Thomsett, August 7
- Added byMichael C. Thomsett
- August 7
Why Haven't You Started Investing Yet?
You are probably aware that investment opportunities are great for building wealth. Whether you opt for stocks and shares, precious metals, forex trading, or something else besides, you could afford yourself financial freedom. But if you haven't dipped your toes into the world of investing yet, we have to ask ourselves why.
By Kim, August 7

- Added byKim
- August 7
Historical Drawdowns for Global Equity Portfolios
Globally diversified equity portfolios typically hold thousands of stocks across dozens of countries. This degree of diversification minimizes the risk of a single company, country, or sector. Because of this diversification, investors should be cautious about confusing temporary declines with permanent loss of capital like with single stocks.
By Jesse, August 6

- Added byJesse
- August 6
Types of Volatility
Are most options traders aware of five different types of volatility? Probably not. Most only deal with two types, historical and implied. All five types (historical, implied, future, forecast and seasonal), deserve some explanation and study.
By Michael C. Thomsett, August 1
- Added byMichael C. Thomsett
- August 1
The Performance Gap Between Large Growth and Small Value Stocks
Academic research suggests there are differences in expected returns among stocks over the long-term. Small companies with low fundamental valuations (Small Cap Value) have higher expected returns than big companies with high valuations (Large Cap Growth).
By Jesse, July 21
- Added byJesse
- July 21
How New Traders Can Use Trade Psychology To Succeed
People have been trying to figure out just what makes humans tick for hundreds of years. In some respects, we’ve come a long way, in others, we’ve barely scratched the surface. Like it or not, many industries take advantage of this knowledge to influence our behaviour and buying patterns.
- Added byKim
- July 21
A Reliable Reversal Signal
Options traders struggle constantly with the quest for reliable
By Michael C. Thomsett, July 20
- Added byMichael C. Thomsett
- July 20
Premium at Risk
Should options traders consider “premium at risk” when entering strategies? Most traders focus on calculated maximum profit or loss and breakeven price levels. But inefficiencies in option behavior, especially when close to expiration, make these basic calculations limited in value, and at times misleading.
By Michael C. Thomsett, July 13
- Added byMichael C. Thomsett
- July 13
Diversified Leveraged Anchor Performance
In our continued efforts to improve the Anchor strategy, in April of this year we began tracking a Diversified Leveraged Anchor strategy, under the theory that, over time, a diversified portfolio performs better than an undiversified portfolio in numerous metrics. Not only does overall performance tend to increase, but volatility and drawdowns tend to decrease: