Options traders constantly seek the elusive reliable reversal signal. A few unusual but strong reversals are worth looking for, and their patterns reveal likely exceptional timing for opening or closing option trades. One example of this exceptionally strong signal is the island cluster (or, island reversal).
The attributes are easily spotted on a chart, but it does not appear often. It consists of three specific parts. First, price gaps away from the current trading range, either above or below. The gap itself is significant, but it can mean may things: reversal, continuation, or just momentary volatility.
The second attribute is trading in the new range, but only for a limited number of sessions. The “typical” island cluster consists of three to six sessions. Every trader knows that several things can happen next: Continued trading in the new range, movement in the same direction, or movement reversing and going back to the previous range. In other words, at the point of the second phase, you cannot know what will happen next.
The third attribute is where a call to action occurs. It consists of a gap in the opposite direction, setting up the cluster. Now there is a limited trading activity set off by gaps on both sides, concluding with price moving back to the previous level. This forecasts a strong trend in the direction of the second gap.
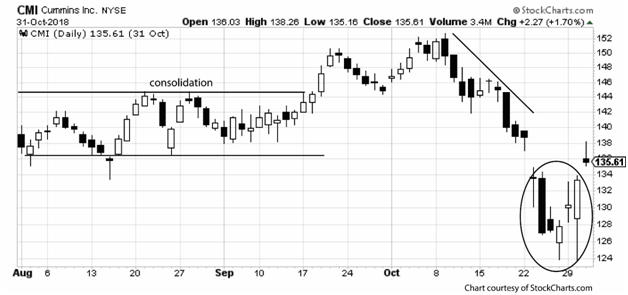
An example of this was seen on the chart of Cummins (CMI). In August and September price was stuck in consolidation between $135 and $145 per share. A breakout in late September took price above the consolidation range and led to a strong downtrend in October. Price moved from a high of $152 down to $139 in less than two weeks. Then a gap appeared, moving price further, down to $134.

The new low was significant, as it remained below the previous support level during consolidation, of $135 per share. Trading remained in this range, from $135 down to $125 for six sessions.
Next, price gapped higher, from a close of about $133 up above $135. In this pattern, creating an island cluster, the signal was clear. Because the price after the gap closed at the previous support price during consolidation, the signal clearly predicted a new bullish move.
This is typical after the island cluster. Price tends to move away from the cluster, often strongly, and to either set up a new range, or to remain volatile in the short term. Either event is appealing to options traders.
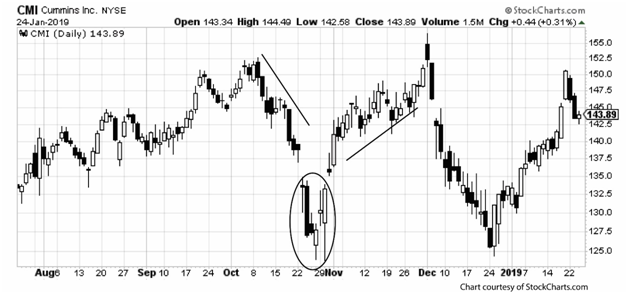
In the example, CMI price did as predicted, moving higher. This is shown in the second chart.

This chart extends beyond the timing of the island cluster. The six-day island cluster was visible after the pattern was concluded. As predicted, it took price higher over the following month, moving from $135 to as high as $155. It later plunged back to $125 over the first three weeks of December, then turning bullish once again.
The volatility after the conclusion of the island cluster could be disturbing to many equity traders. But to options traders, this situation sets up attractive swing trading possibilities, especially given the overall range between $125 on the low side and $155 on the high side.
Trading options at the conclusion of the island cluster is indicated in one of the following ways:
Open short callsopen long puts
Open short putsopen long calls
For traders with no open positions, the conclusion of an island cluster indicates new trades that should be opened, and timing is excellent for a bullish move. However, before embarking on any new positions, seek confirmation from a secondary signal. The long white session before the concluding gap, followed by another long white session on the second day after the gap, may be view as bullish confirmation.
A bullish trade is indicated when the island cluster occurs to the downside, as in this example. This may consist of selling to open a short putlong call
Timing of trades depends on a trader’s strategic viewpoint. For long options, a one-month time to expiration is likely to work best. Price will not include excessive time value and time decay will not accelerate until the final two weeks of the option’s life. For short options, the idea timing is one week to 10 days. This will include a weekend with following Friday expiration and time decay will be rapid. This means the chances for being able to buy to close at a profit will be at maximum.
The weekend is essential in the timing of a short trade. On average, options lose one-third of their remaining time value between he Friday before expiration and the Monday of expiration week. This timing, combined with the exceptional reversal signal provided by the island cluster, is the key element to timing of options trades in this situation.
The same overall timing strategy can be applied to any strong signal with confirmation, and timing is as important as proximity in every instance. The idea option trade will be at the money or slightly out of the money (for long) or in the money (for short). These proximity guidelines minimize cost for long positions while keeping the trade close to the strike; and maximize premium income for short positions while setting up the opportunity for profits from rapid time decay – all if price behaves as expected. And this is the element of uncertainty that makes options trading interesting. Manageable risk levels produce profits when reversal and confirmation are recognized … most of the time. However, traders – especially swing traders – also need to be realistic about the possibility that even the strongest signals are misleading at times.
Michael C. Thomsett is a widely published author with over 80 business and investing books, including the best-selling Getting Started in Options , coming out in its 10th edition later this year. He also wrote the recently released The Mathematics of Options . Thomsett is a frequent speaker at trade shows and blogs on his website at Thomsett Guide as well as on Seeking Alpha, LinkedIn, Twitter and Facebook.
What Is SteadyOptions?
Full Trading Plan
Complete Portfolio Approach
Diversified Options Strategies
Exclusive Community Forum
Steady And Consistent Gains
High Quality Education
Risk Management, Portfolio Size
Performance based on real fills
Non-directional Options Strategies
10-15 trade Ideas Per Month
Targets 5-7% Monthly Net Return
Recent Articles
Articles
Pricing Models and Volatility Problems
Most traders are aware of the volatility-related problem with the best-known option pricing model, Black-Scholes. The assumption under this model is that volatility remains constant over the entire remaining life of the option.
By Michael C. Thomsett, August 16

- Added byMichael C. Thomsett
- August 16
Option Arbitrage Risks
Options traders dealing in arbitrage might not appreciate the forms of risk they face. The typical arbitrage position is found in synthetic long or short stock. In these positions, the combined options act exactly like the underlying. This creates the arbitrage.
By Michael C. Thomsett, August 7

- Added byMichael C. Thomsett
- August 7
Why Haven't You Started Investing Yet?
You are probably aware that investment opportunities are great for building wealth. Whether you opt for stocks and shares, precious metals, forex trading, or something else besides, you could afford yourself financial freedom. But if you haven't dipped your toes into the world of investing yet, we have to ask ourselves why.
By Kim, August 7

- Added byKim
- August 7
Historical Drawdowns for Global Equity Portfolios
Globally diversified equity portfolios typically hold thousands of stocks across dozens of countries. This degree of diversification minimizes the risk of a single company, country, or sector. Because of this diversification, investors should be cautious about confusing temporary declines with permanent loss of capital like with single stocks.
By Jesse, August 6

- Added byJesse
- August 6
Types of Volatility
Are most options traders aware of five different types of volatility? Probably not. Most only deal with two types, historical and implied. All five types (historical, implied, future, forecast and seasonal), deserve some explanation and study.
By Michael C. Thomsett, August 1

- Added byMichael C. Thomsett
- August 1
The Performance Gap Between Large Growth and Small Value Stocks
Academic research suggests there are differences in expected returns among stocks over the long-term. Small companies with low fundamental valuations (Small Cap Value) have higher expected returns than big companies with high valuations (Large Cap Growth).
By Jesse, July 21

- Added byJesse
- July 21
How New Traders Can Use Trade Psychology To Succeed
People have been trying to figure out just what makes humans tick for hundreds of years. In some respects, we’ve come a long way, in others, we’ve barely scratched the surface. Like it or not, many industries take advantage of this knowledge to influence our behaviour and buying patterns.

- Added byKim
- July 21
A Reliable Reversal Signal
Options traders struggle constantly with the quest for reliable
By Michael C. Thomsett, July 20

- Added byMichael C. Thomsett
- July 20
Premium at Risk
Should options traders consider “premium at risk” when entering strategies? Most traders focus on calculated maximum profit or loss and breakeven price levels. But inefficiencies in option behavior, especially when close to expiration, make these basic calculations limited in value, and at times misleading.
By Michael C. Thomsett, July 13

- Added byMichael C. Thomsett
- July 13
Diversified Leveraged Anchor Performance
In our continued efforts to improve the Anchor strategy, in April of this year we began tracking a Diversified Leveraged Anchor strategy, under the theory that, over time, a diversified portfolio performs better than an undiversified portfolio in numerous metrics. Not only does overall performance tend to increase, but volatility and drawdowns tend to decrease:
Tuesday, January 28, 2020