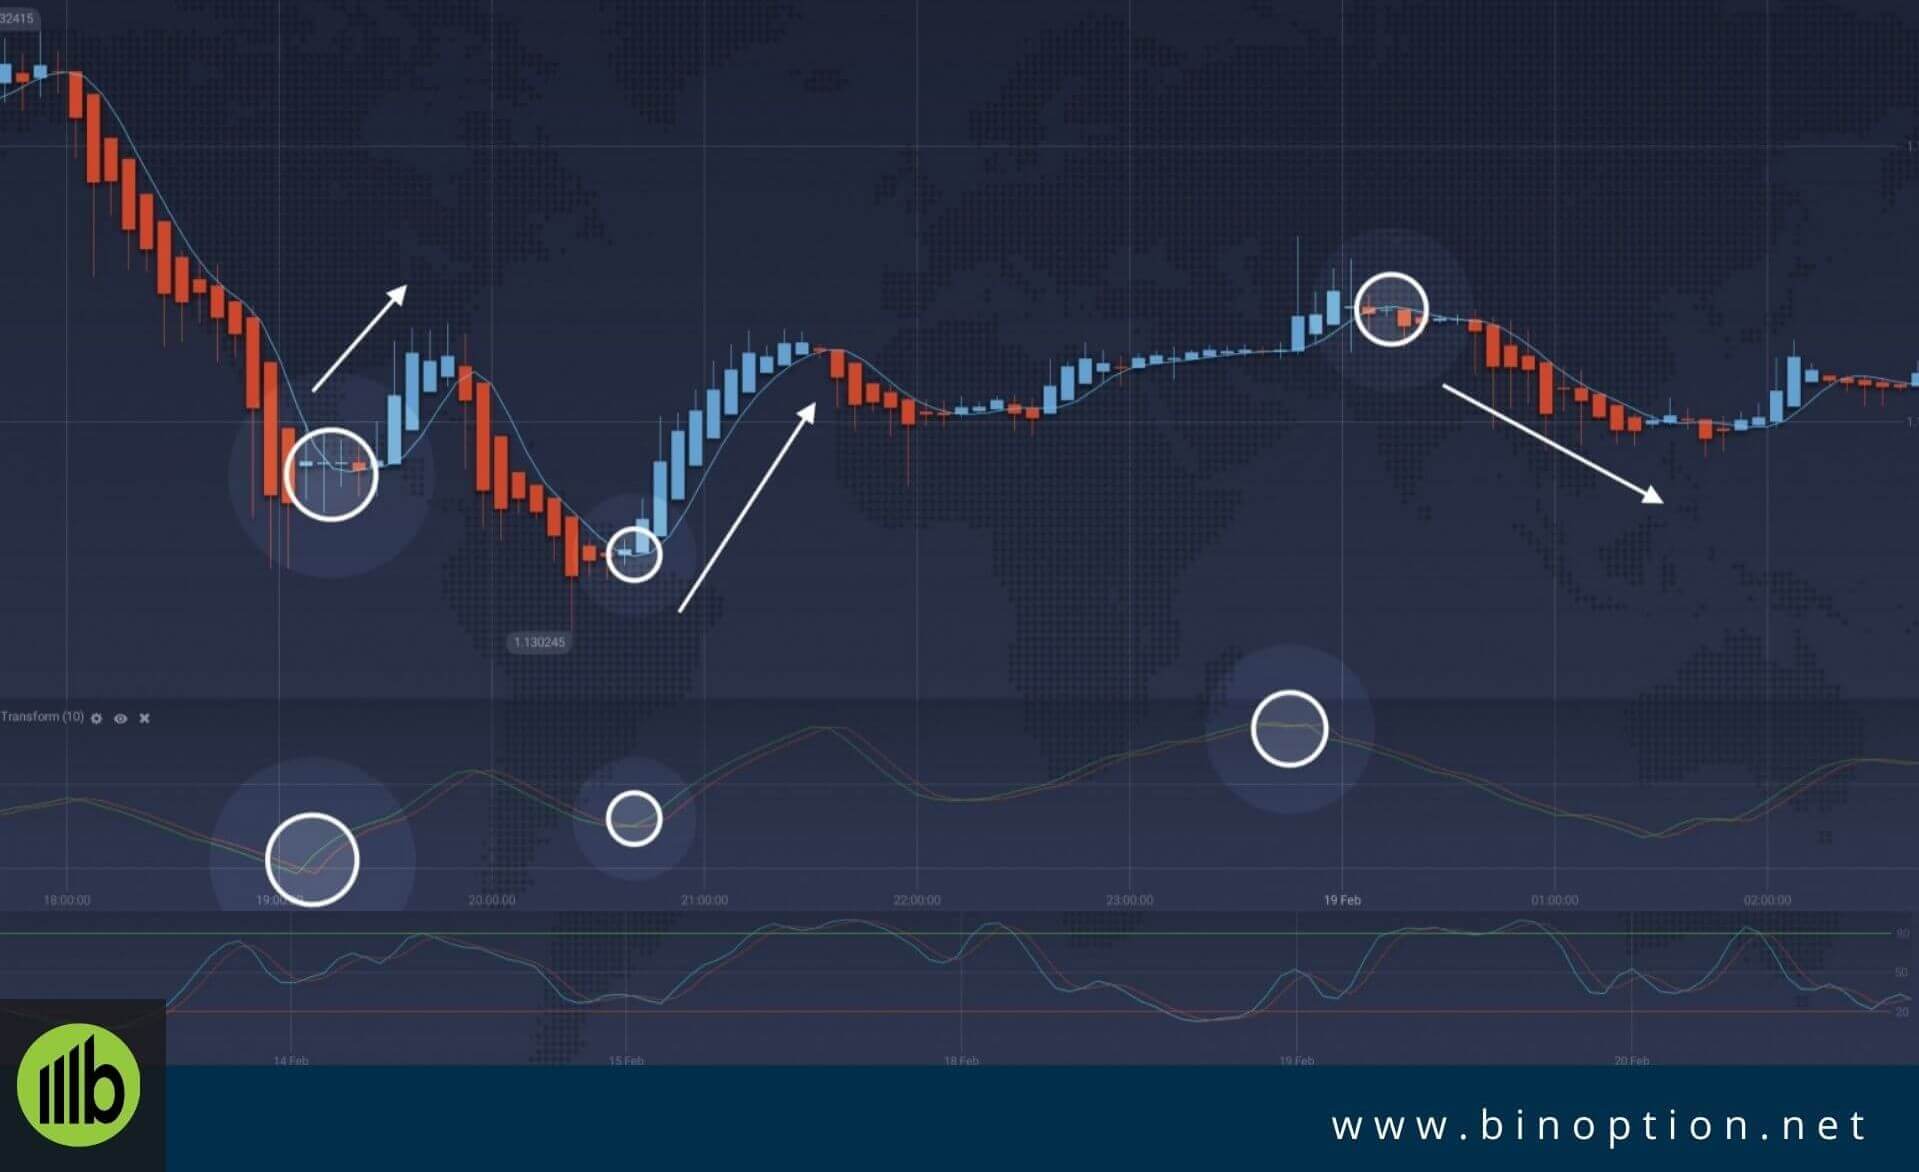
Fisher Transform is a technical indicator that helps traders to identify the “oversold” and “overbought” market condition. Moreover, this indicator also convert prices into Gaussian normal distribution. As technical analysis is necessary for traders and it is recommended to use correctly to get a better result.
This indicator created by J.F. Ehlers. Thus, traders can use the Fisher Transform indicator on the different trading platform, but today we will show you the setup process on the BinaryCent platform.
Binary Cent is an online trading platform that is newly introduced itself as a options broker. You can read a complete review on BinaryCent
Today we are taking a closer look at this popular trend-following indicator that can add a valuable result in your trading system.
What Is Ehler’s Fisher Transform
The Fisher Transform indicator was first introduced by J.F. Ehlers. This indicator highlights prices when it moves to an extreme based on recent prices. Not only that but also it helps traders to show the trend, and isolate the price waves within a trend.
Today’s blog post is a bit technical for readers. So, please read the article very carefully to understand the indicator and how it works.
Also, you can use the BinaryCent demo platform for practical application of different indicators. Moreover, Demo trading will help you to improve trading skills. To avail the facility, traders have to deposit an initial amount of $250.
Normal Distribution
We have already mentioned the term of Gaussian normal distribution
A normal distribution also called bell-curve that is a common probability distribution. As per the rule:
- the Mean value is equal to the Median value
- the left and the right halves of the graph are symmetrical.
On the other hand, the quantitative variable does not follow the normal distribution. You can count the asset price as a quantitative variable.
How To Use Fisher Transform Indicator

Fisher Transform indicator transfigures prices into a normal distribution. A bell-curve or normal distribution can be used later in technical analysis
The major fundamental rule is
- The asset is overbought when the Fisher Transform is above the zero line and goes up.
- The asset is oversold when Fisher Transform is below the zero line or goes down.
It is mandatory to note that in both mentioned cases, the probability of a trend reversal gets higher with time.
Traders consider to open a corresponding position, after receiving a buy or sell signal from another indicator. It also confirms that the signal sent by Fisher.
Traders compare the Fisher Transform indicator to the Stochastic Oscillator. Both trading indicators work similarly.
Note that no technical analysis indicator is capable of providing accurate trading results. And the Fisher Transform is not an exception.
But according to the expert analyst, this particular indicator generates buy and sell signals earlier than other market-leading indicators.