
Here is one of the analytical tools that allows us to claim "In options we are Big Data!" For those who want to find the movers and shakers, Advanced Ranker does the job. The Advanced Ranker combines an easy to use interface with a powerful sorting logic built on IVR and IVP.
You may be familiar with IVR and IVP, as they’ve become relatively commonplace since we started offering them, but let us review them nonetheless. IVR is the Implied Volatility Rank. It uses the IV over the past year as a baseline from which it ranks the current IV. Sound complicated? It isn’t—let’s illustrate this with an example:
Assuming volatility hit its high at 135 and its low at 33, and the current volatility is 76, we do the following calculation:
The formula for this is: (current IV – low IV)/(high IV – low IV) * 100 = IVR
In the above example, the IVR is just below the middle of its 52 week range. Since regression to the mean is the fundamental concept, the first task is to estimate the mean. Volatility charts are useful to help determine an estimate for the mean considering it can change dramatically after events such as an announced take over or FDA announcement creating a new "relevant range."
Typically, an IVR over 50% suggests rising implied volatility often seem before earnings announcements when it advances into the report date and then begins declining back toward the mean. This could be good news for volatility strategists to be long options into the report date and then reverse their position anticipating declining implied volatility after the report. In general, a low IVR suggests implied volatility is likely to rise back toward the mean while a high IVR suggests that it is likely to decline.
IVP is the Implied Volatility Percentile—indicating how often
To highlight the difference between these two measures, while the IVR may only be 40%, thus suggesting the current IV is in the lower part of its range, the IVP may be 90, suggesting that 90% of the time
A rough and ready interpretation of IVP is when considering buying options, look for a low IVP, but when considering selling options, look for a high IVP. This way, you can profit off the price of volatility, rather than pay it.
High implied volatility relative to the past implied volatility, usually found before events such as earnings reports or FDA announcements, indicates increased options prices in expectation of a large move in the underlying. While the actual move may not be as severe as suggested by the implied volatility, on occasion it may be even greater resulting in what could be a substantial loss for an option position that is short on one side. One way to mitigate this risk is to be short both sides by using an Iron Condor or perhaps an Iron Butterfly. Another alternative is to go with the flow and accept the possibility that the underlying could move even more than suggested by the implied volatility. Calendar spreads, short the near-term option while long the deferred, may also be considered, but with short gamma, or rate of change of delta, a large move in the underlying will results in a loss.
Let’s look at an example:
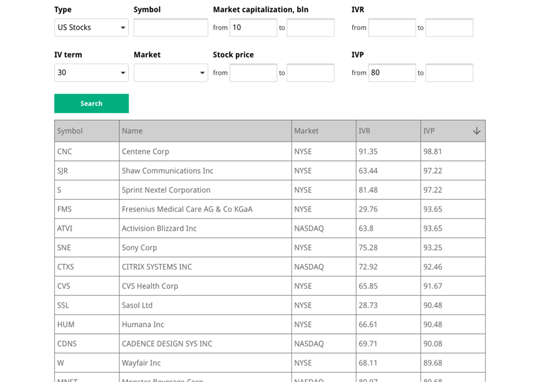
In this example the minimum Market Cap was set at of $10B. This may not be necessary since the Advanced Ranker filters out any symbols with inconclusive or difficult to calculate IV data. Next for IVP the minimum was set at 80 and sorted by descending IVP. Typically, a high IVP suggests an increased the risk of a large move in the underlying. In the top category are CNC, STR, S, etc. A quick google search reveals these companies are planning earnings reports in the next few weeks. The high IVP’s are earnings report related and since they will not report for a few weeks the IVP could increase even more. In fact, the first 8 results are planning to release earnings in the next few weeks (who doesn’t love earnings seasons).
For SSL the earnings call isn’t until June. Of course, this requires more investigation, but at onset, it seems like a prime candidate for a long volatility strategy into the earnings report date. IVR shows implied volatility has been over three times its current value, but very infrequently. This suggests implied volatility will likely decline. Here, an astute trader could gain from the higher implied volatility using short puts. Of course, it's necessary to understand the risks associated with selling puts.
An alternative use for the Advanced Ranker is to just use it to search for an underlying when seeking volatility strategies since the Advanced Ranker can help to determine if-and-when options on that underlying are over- or under- priced.
When looking for trade ideas, the Advanced Ranker will produce a treasure chest full of ideas. In a probability-based environment, getting on the right side of the odds will enhance the bottom line.
All SteadyOptions subscriptions include FREE access to IVolatility Tools ($468/year value) . The same set of tools is also available as a Standalone Subscription for non members.
What Is SteadyOptions?
Full Trading Plan
Complete Portfolio Approach
Diversified Options Strategies
Exclusive Community Forum
Steady And Consistent Gains
High Quality Education
Risk Management, Portfolio Size
Performance based on real fills
Non-directional Options Strategies
10-15 trade Ideas Per Month
Targets 5-7% Monthly Net Return
Recent Articles
Articles
Pricing Models and Volatility Problems
Most traders are aware of the volatility-related problem with the best-known option pricing model, Black-Scholes. The assumption under this model is that volatility remains constant over the entire remaining life of the option.
By Michael C. Thomsett, August 16

- Added byMichael C. Thomsett
- August 16
Option Arbitrage Risks
Options traders dealing in arbitrage might not appreciate the forms of risk they face. The typical arbitrage position is found in synthetic long or short stock. In these positions, the combined options act exactly like the underlying. This creates the arbitrage.
By Michael C. Thomsett, August 7
- Added byMichael C. Thomsett
- August 7
Why Haven't You Started Investing Yet?
You are probably aware that investment opportunities are great for building wealth. Whether you opt for stocks and shares, precious metals, forex trading, or something else besides, you could afford yourself financial freedom. But if you haven't dipped your toes into the world of investing yet, we have to ask ourselves why.
By Kim, August 7

- Added byKim
- August 7
Historical Drawdowns for Global Equity Portfolios
Globally diversified equity portfolios typically hold thousands of stocks across dozens of countries. This degree of diversification minimizes the risk of a single company, country, or sector. Because of this diversification, investors should be cautious about confusing temporary declines with permanent loss of capital like with single stocks.
By Jesse, August 6

- Added byJesse
- August 6
Types of Volatility
Are most options traders aware of five different types of volatility? Probably not. Most only deal with two types, historical and implied. All five types (historical, implied, future, forecast and seasonal), deserve some explanation and study.
By Michael C. Thomsett, August 1
- Added byMichael C. Thomsett
- August 1
The Performance Gap Between Large Growth and Small Value Stocks
Academic research suggests there are differences in expected returns among stocks over the long-term. Small companies with low fundamental valuations (Small Cap Value) have higher expected returns than big companies with high valuations (Large Cap Growth).
By Jesse, July 21
- Added byJesse
- July 21
How New Traders Can Use Trade Psychology To Succeed
People have been trying to figure out just what makes humans tick for hundreds of years. In some respects, we’ve come a long way, in others, we’ve barely scratched the surface. Like it or not, many industries take advantage of this knowledge to influence our behaviour and buying patterns.
- Added byKim
- July 21
A Reliable Reversal Signal
Options traders struggle constantly with the quest for reliable
By Michael C. Thomsett, July 20
- Added byMichael C. Thomsett
- July 20
Premium at Risk
Should options traders consider “premium at risk” when entering strategies? Most traders focus on calculated maximum profit or loss and breakeven price levels. But inefficiencies in option behavior, especially when close to expiration, make these basic calculations limited in value, and at times misleading.
By Michael C. Thomsett, July 13
- Added byMichael C. Thomsett
- July 13
Diversified Leveraged Anchor Performance
In our continued efforts to improve the Anchor strategy, in April of this year we began tracking a Diversified Leveraged Anchor strategy, under the theory that, over time, a diversified portfolio performs better than an undiversified portfolio in numerous metrics. Not only does overall performance tend to increase, but volatility and drawdowns tend to decrease:
Tuesday, October 13, 2020